Our waterfall analysis generator
The waterfall chart (also known as a bridge chart) is an excellent way to explain and model a gap analysis. This graph shows the initial situation, several effects (upward or downward) and the final situation, which corresponds to the initial situation plus the sum of all the effects.
Easily create interactive waterfall analyses: add your own effects, adjust values and automatically see how each positive or negative contribution influences the final result. Ideal for cost analyses, price reviews, financial forecasts and strategic planning.
Finally, you can export your chart directly to PowerPoint format with a single click.
Your data is not stored on our servers.
Waterfall analysis use cases
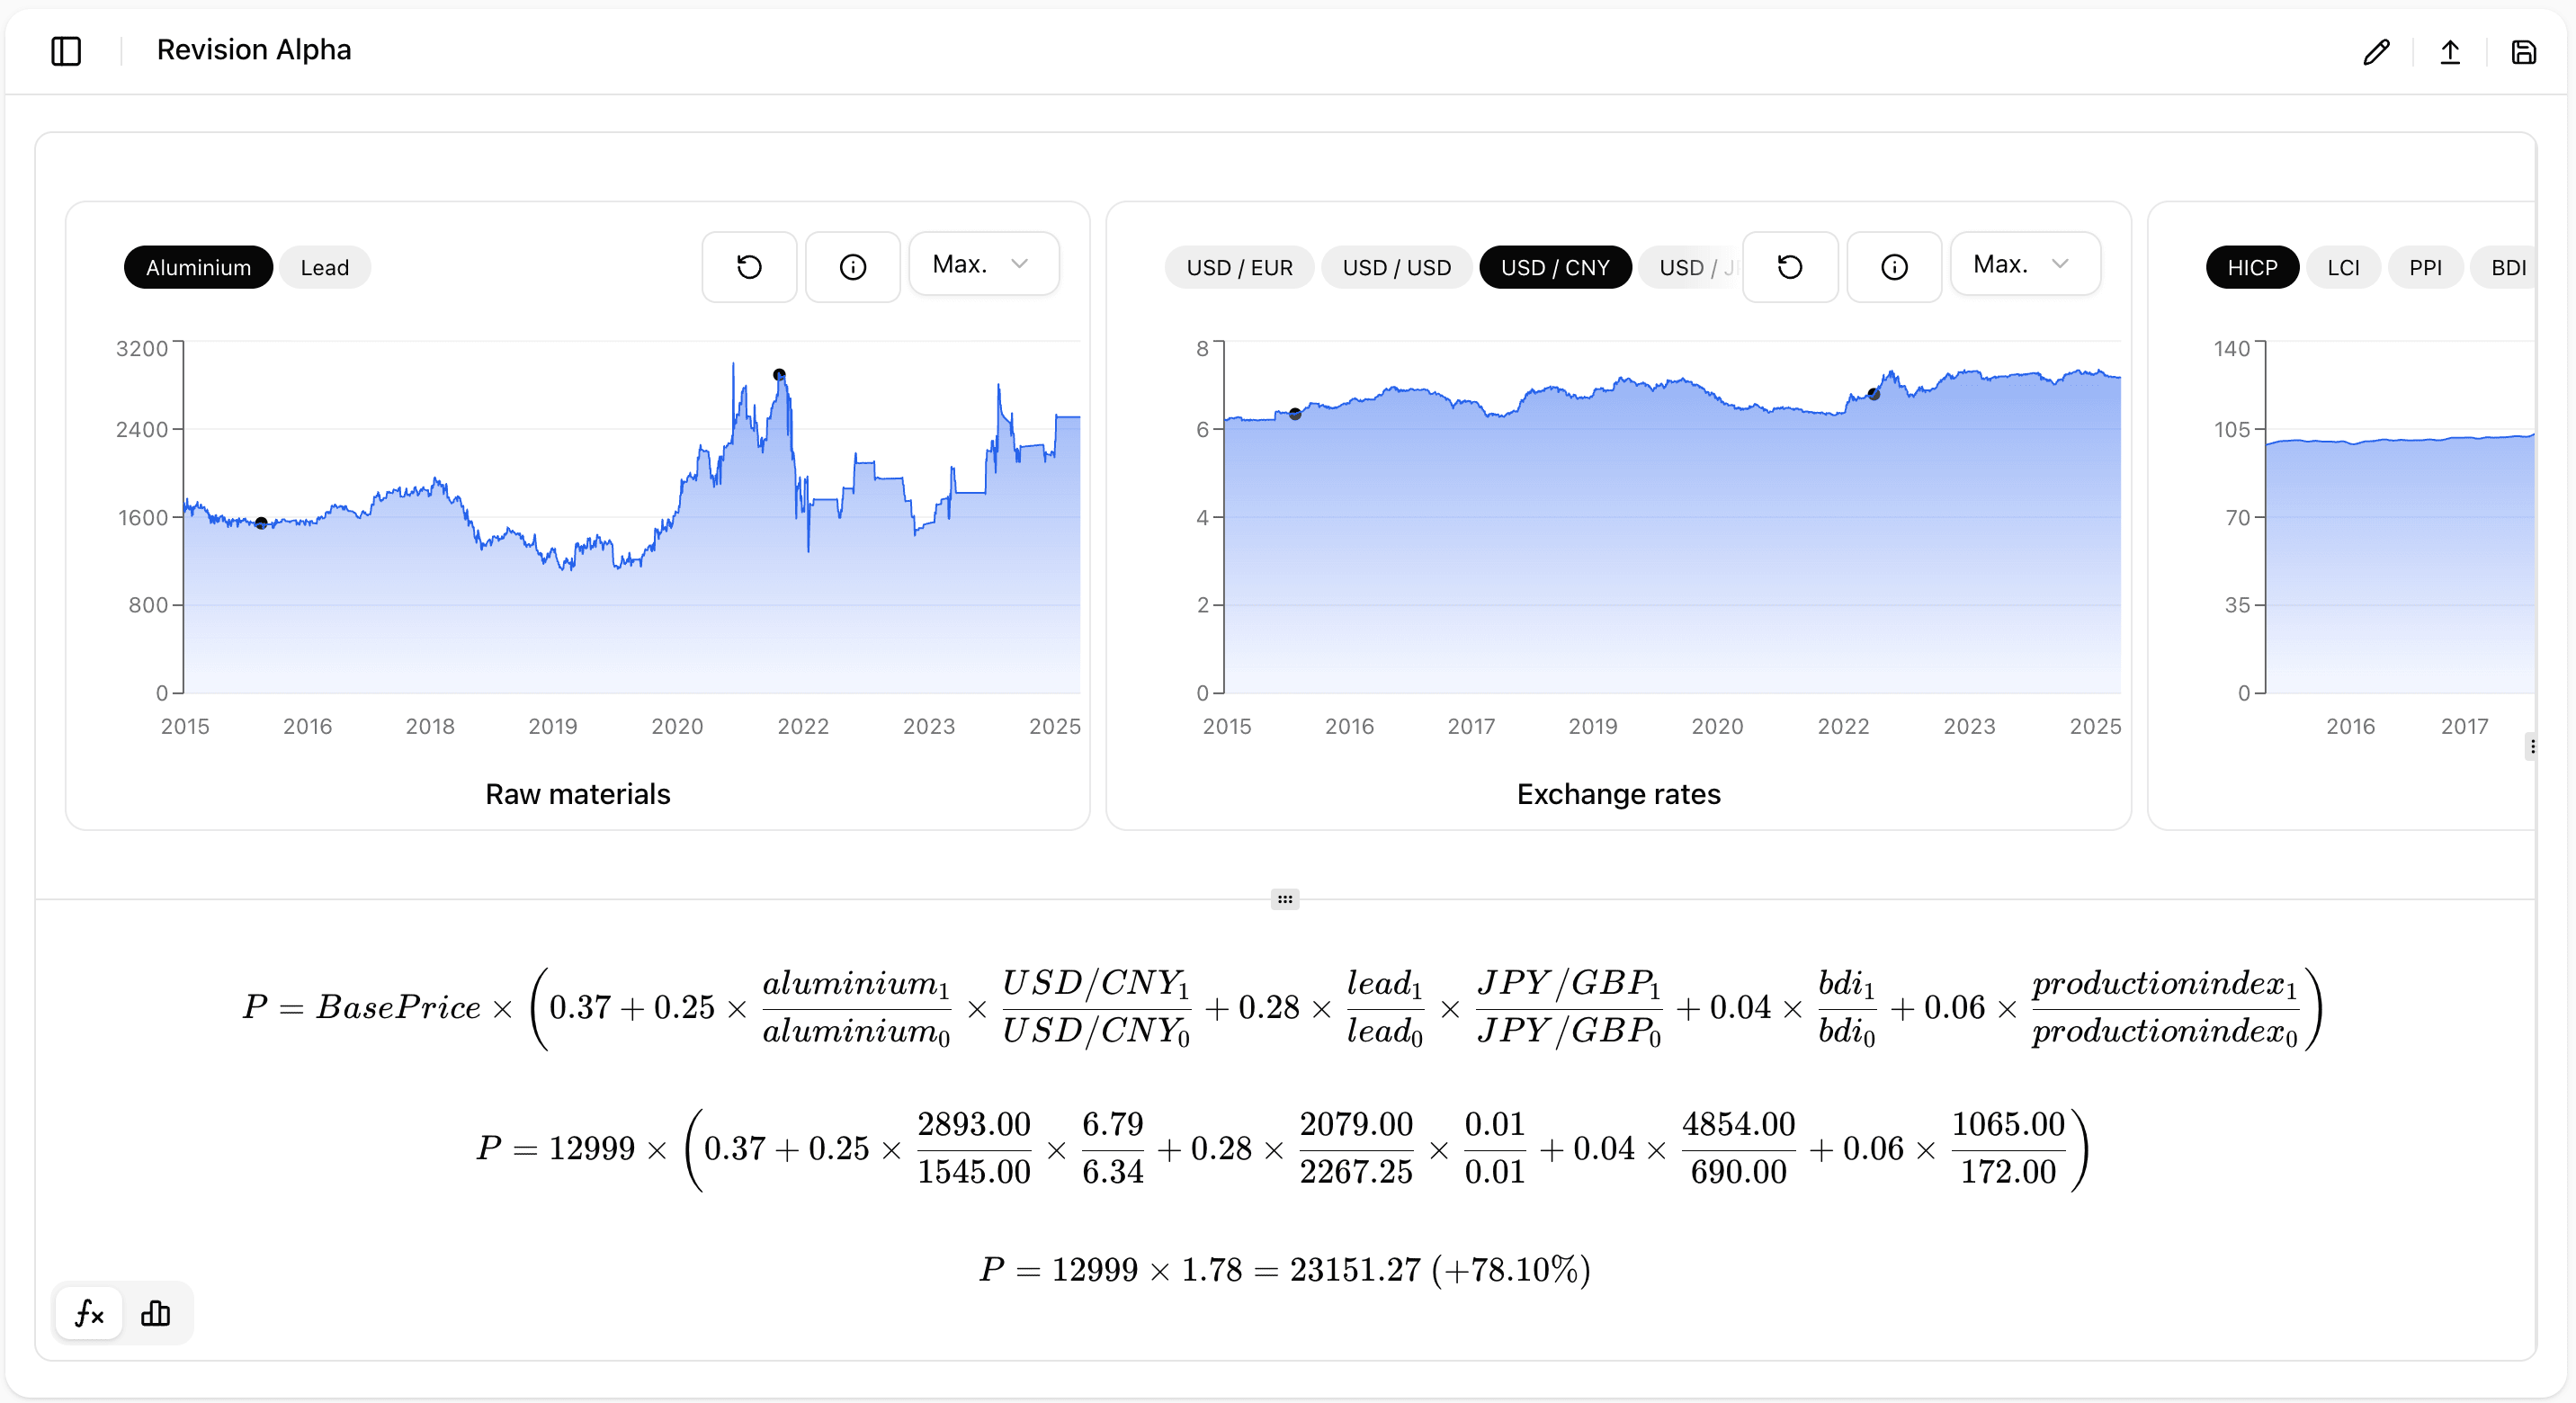
This dynamic waterfall analysis allows you to accurately visualise the impact of each factor on price changes: raw materials, exchange rates, inflation, margins or volumes. It is particularly useful to :
- Justify a price revision to a client
- Analyse raw materials' or exchange rates' impact
- Prepare a contractual or commercial negociation
- Explain deviation to stakeholders (management, shareholders...)
From ad hoc analysis to contract management
This generator helps you build and create waterfall analysis. Convexe allows you to go further by dynamically structuring according to your products, integrating official indices and enabling advanced calculations..
Going further in price analysis
To deepen your analysis :